 |
Pulse processing and Analyses
Dušan Kollár, |
|
|
|
![]()
| Amplitude (Pulse Height) Measurements |
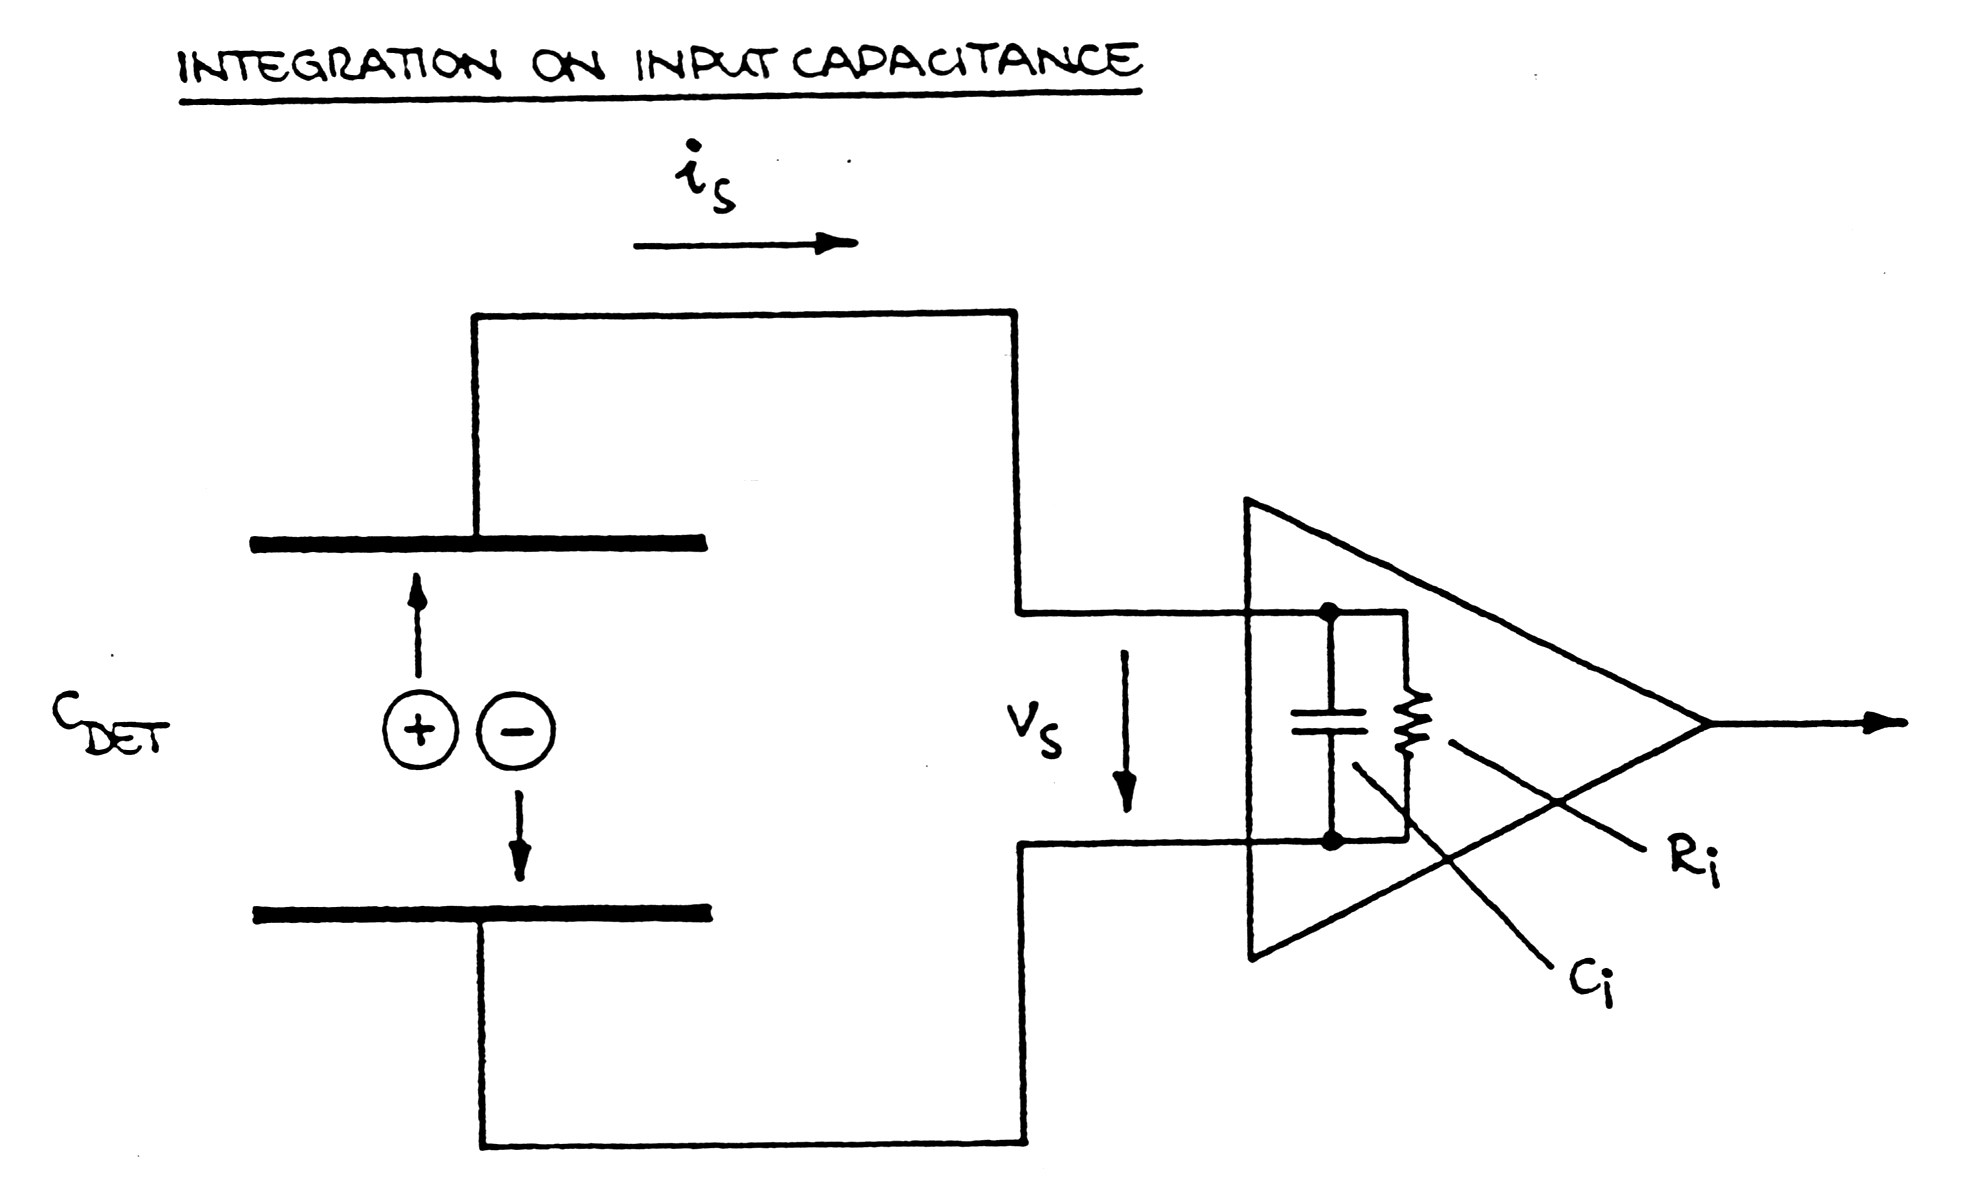
| Integration on input capacitance |
- Determine energy deposited in detector
- Detector signal generally a short current pulse
| Thin silicon detector (10 - 300 pm thick): | 100 ps - 30 ns |
| Thick (~cm) Si or Ge detector: | 1 - 10 ms |
| Proportional chamber (gas): | 10 ns - 10 ms |
| Gas microstrip or microgap chamber: | 10 - 50 ns |
| Scintillator + PMT/APD: | 100ps-10 ms |
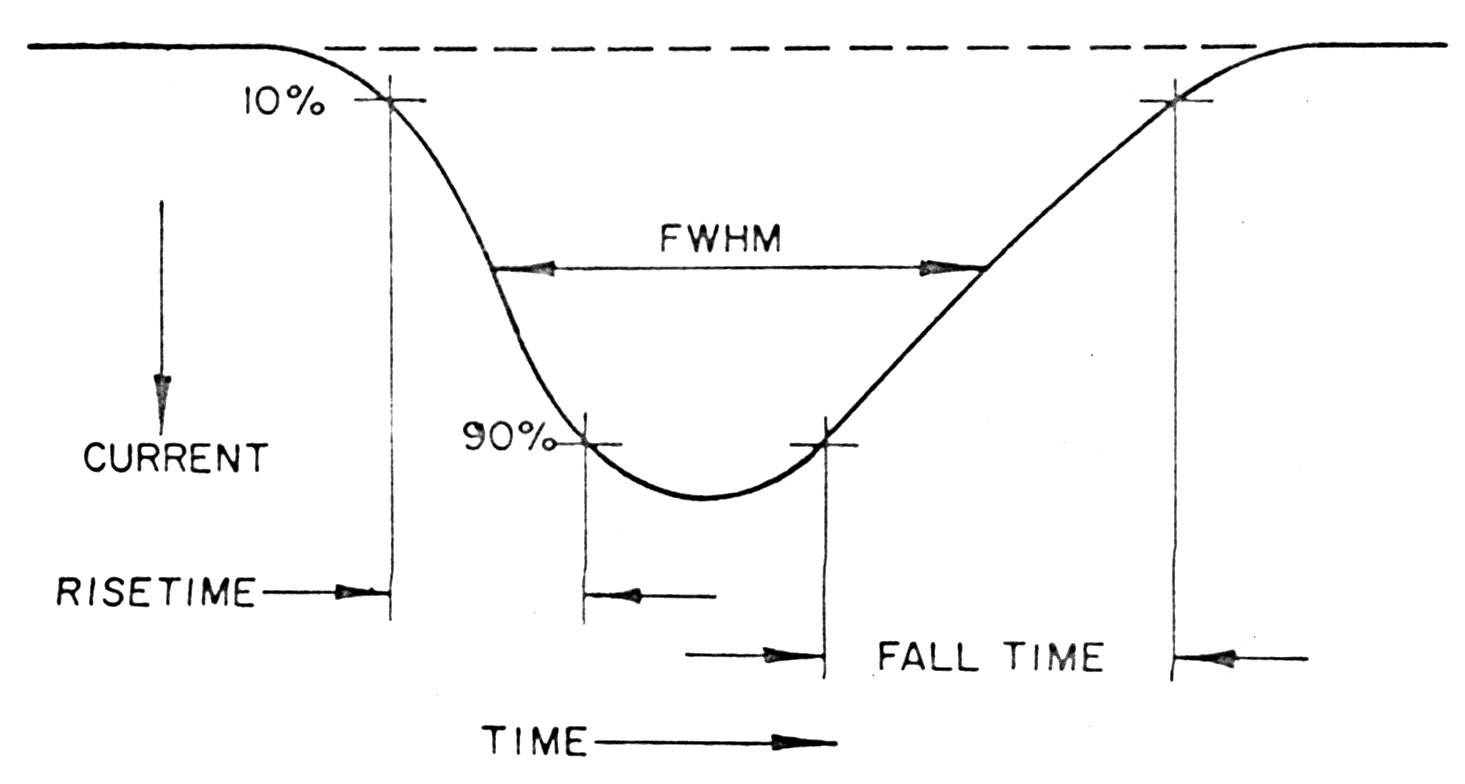 |
Fig. m-1
Parameters of the detector
output pulse.
|
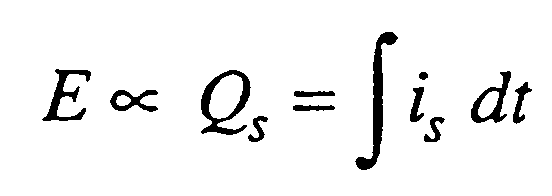
The total charge QS contained in the detector current pulse is is proportional to the energy deposited in the detector
 |
- Necessary to integrate the detector signal current.
- Integrate charge on input capacitance.
- Use integrating ("charge sensitive") preamplifier.
- Amplify current pulse and use integrating ("charge sensing") ADC.
 |
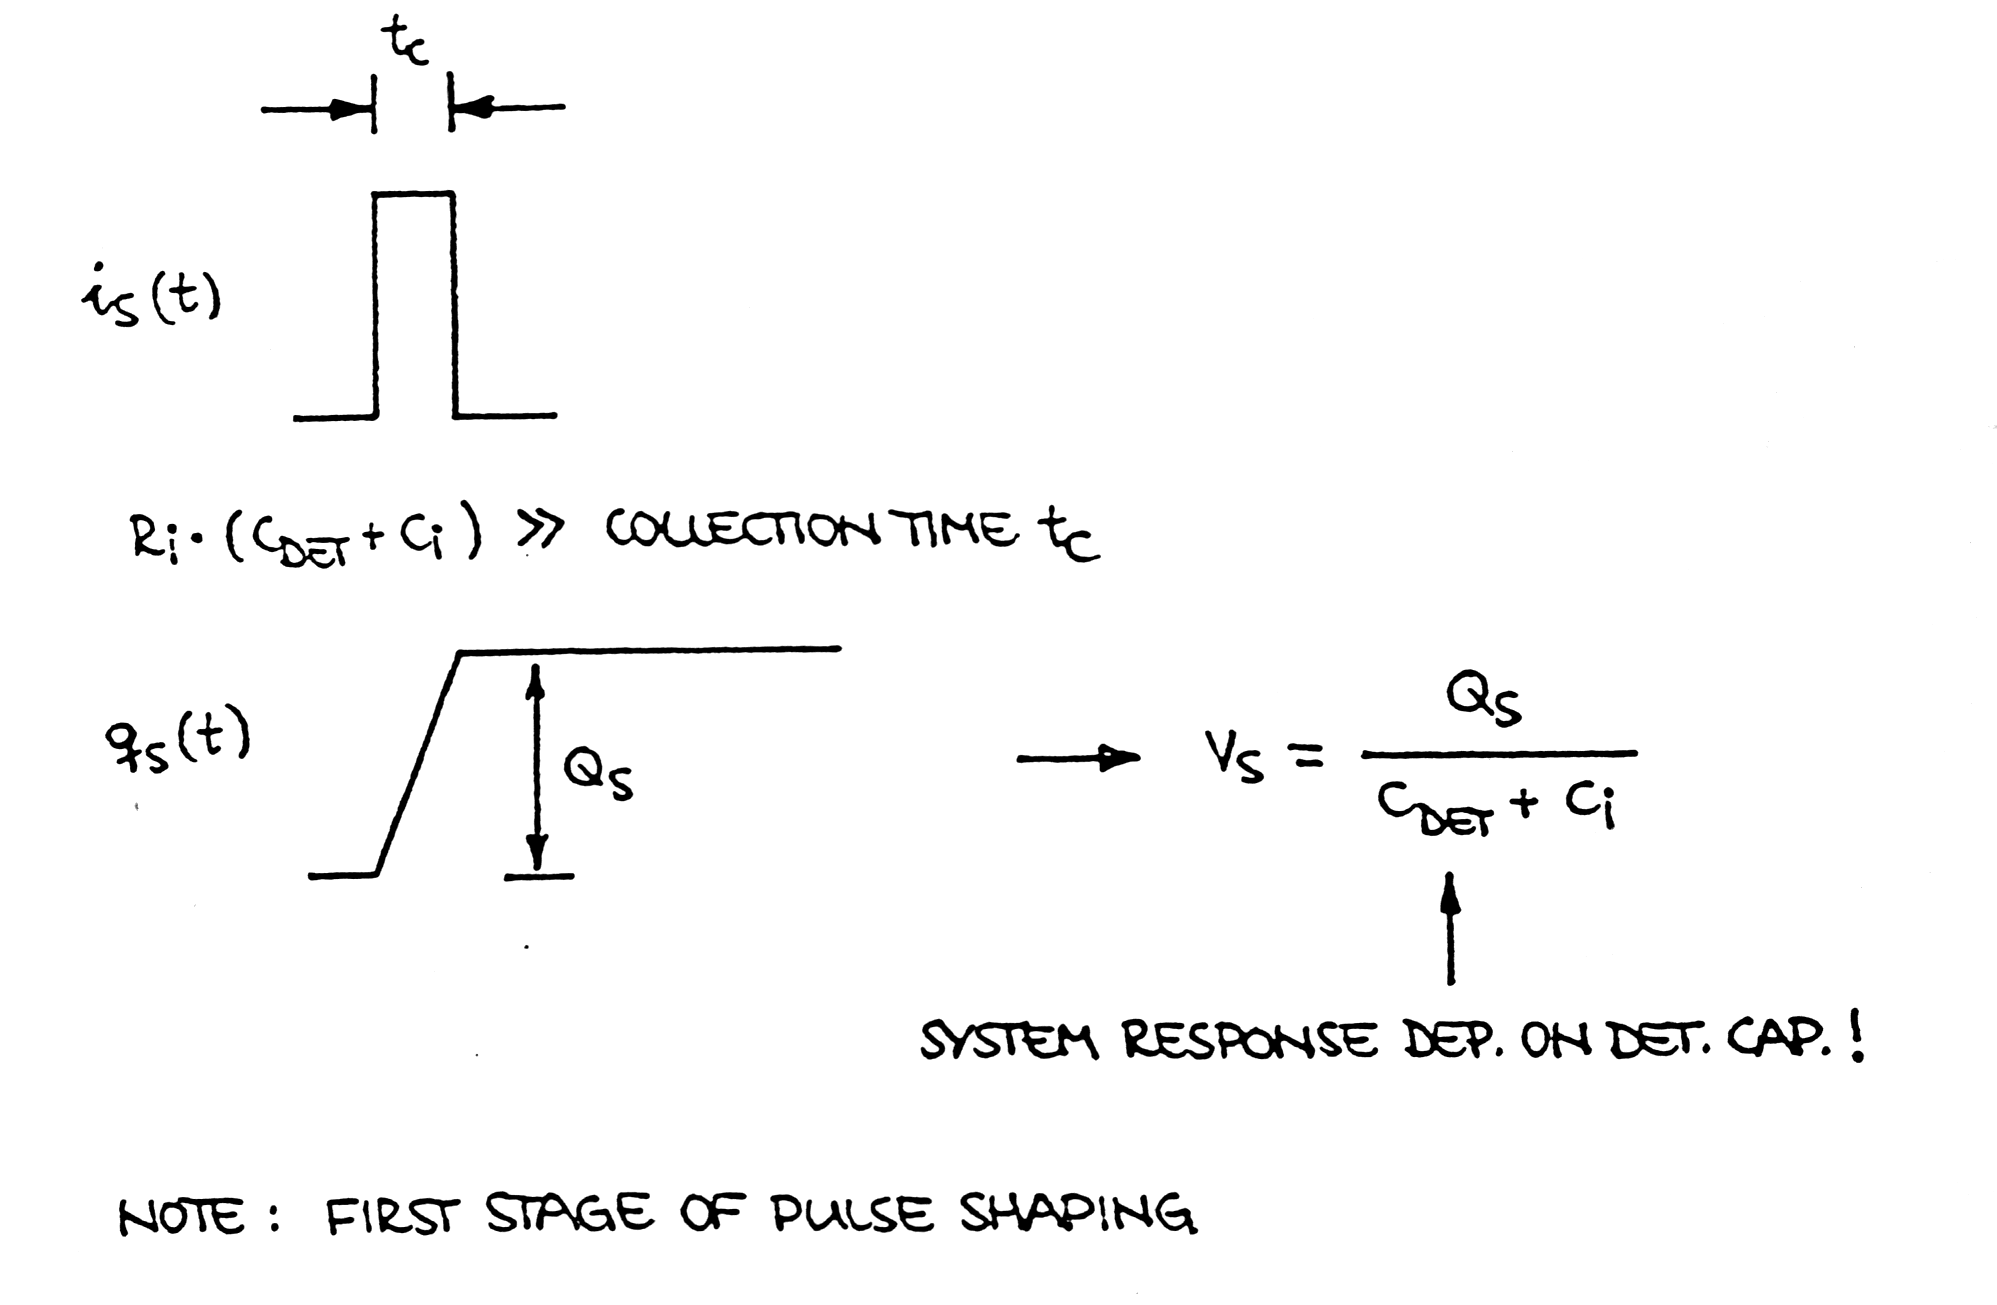 |
| Fig. m-2 Example of first stage of pulse shaping - e.g. integrationon on input capacitance in ionisation chamber detector. |
 |
Fig. m-3Basic posibilities of the current integration:
|
![]()
| Basic spectrometry system |
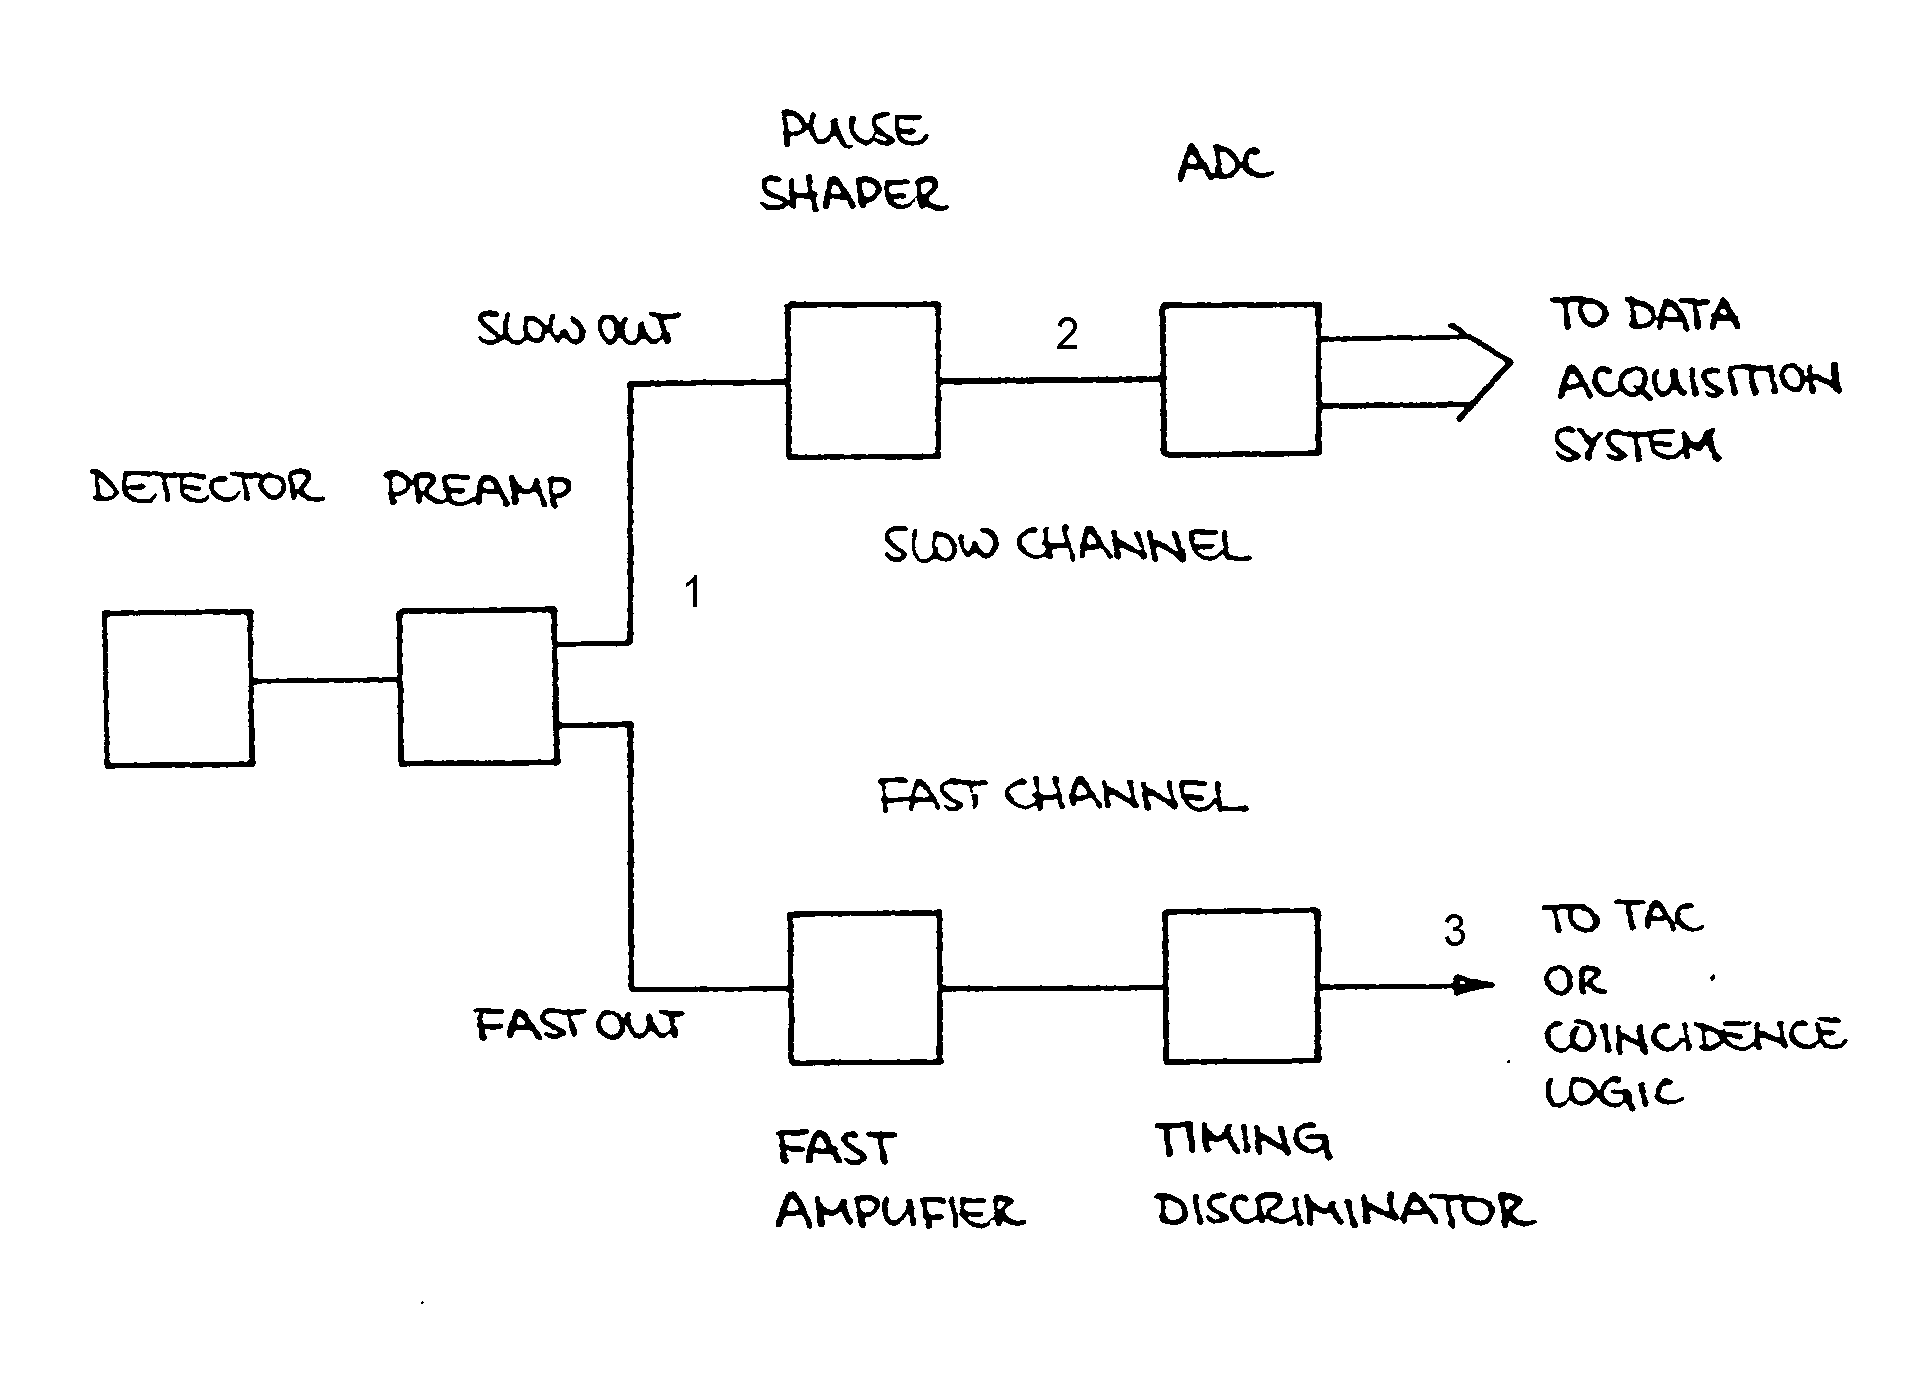 |
| Fig. m-4 A simple example, but complex system - e.g. in high energy physiscs - are often combinations of very many subsystems containing these base elements. |
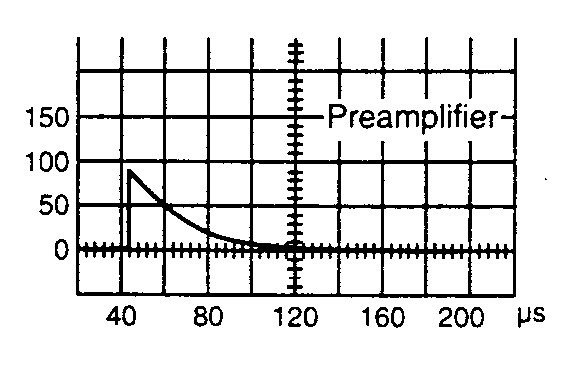
| Fig. m-5 | |
 |
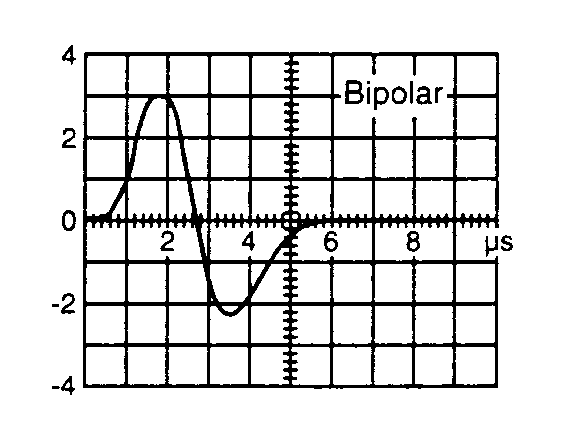 |
| (pulse shape in point 1 on fig. above) | (pulse shape in point 2a on fig. above) |
 |
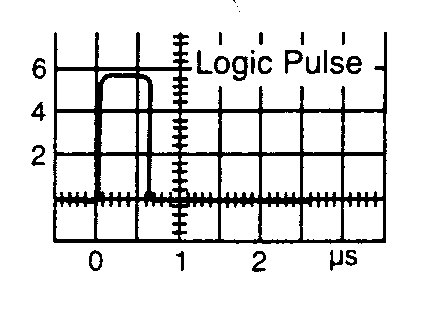 |
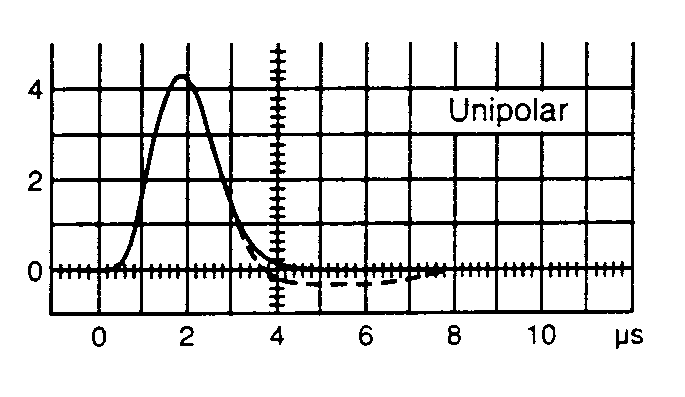
| (pulse shape in point 2b on fig. above) | (pulse shape in point 3 on fig. above) |
| Typical pulses which can be measured in system on fig. above. | |
![]()
| Example of detector resolution |
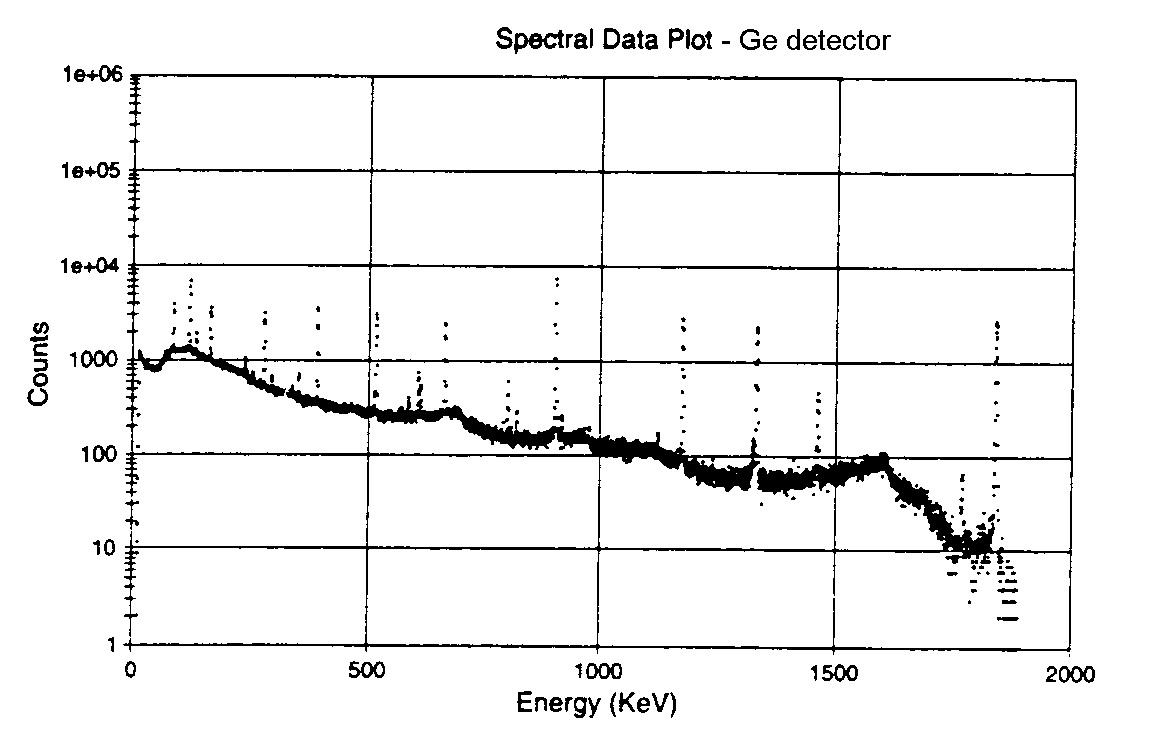
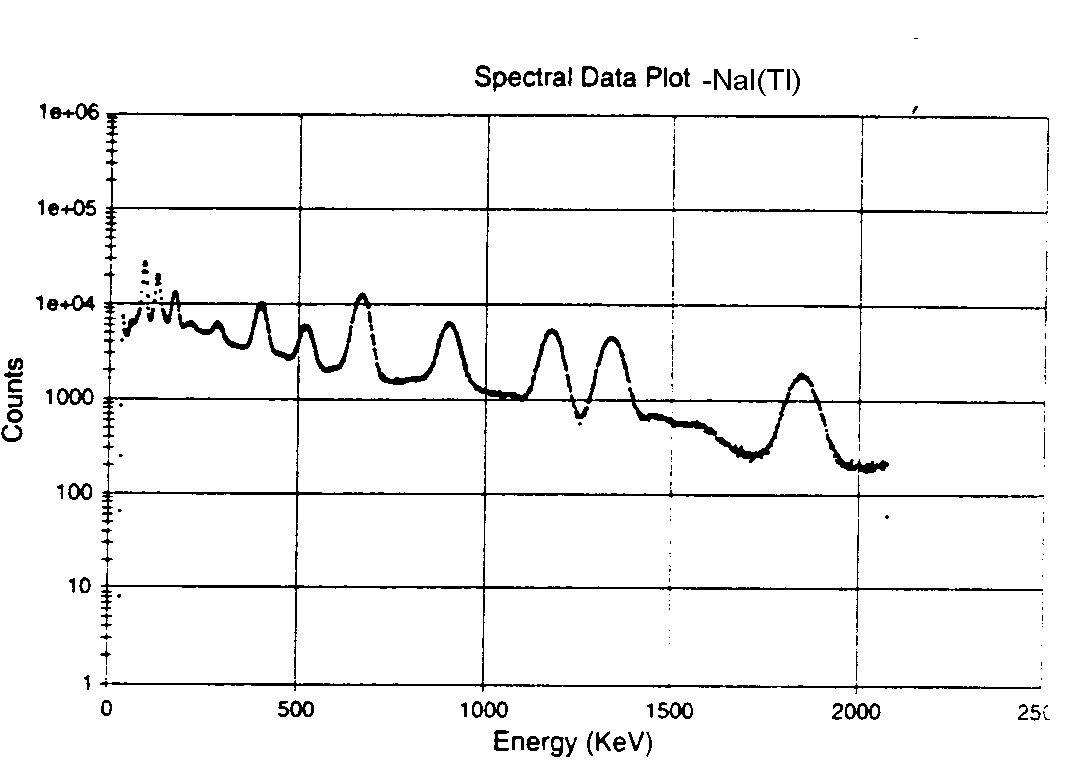
Spectra on figures down are collected
from the same gama - source, but with diferent type of
detector.
 |
 |
| Fig. m-6 Ge
detector
(Resolution expressed in absolute keV). |
Fig. m-7 Scintillator
NaI(Tl) (Resolution -lower as in fig. left - is expressed as FWHM of single peak at specific energy). |
![]()
| Frequency response of linear amplifiers |
|
|
Passive filters CR and RC |
|
|
Amplifier pass band and feedback. |
|
|
Transmission lines. |
![]()
Problem how to design of amplifiers which give uniform gain and phase delay over the frequency pass - band. For example: pass - band in region:
- 20 Hz - 100 kHz for audio amplifiers
- 0 - 4,5 MHz for video amplifiers.
Most circuits for pulse shaping are based on the chain RC and transmission lines. Before proceeding to the subject of pulse processing I will deal briefly with the RC passive filters and with other interesting subject of transmission lines
![]()
| Back to menu |